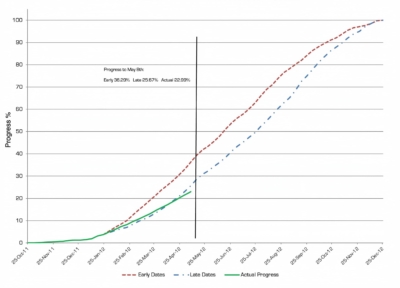
Project controls professionals use the SPI chart to depict whether a project or element of a project is on, ahead or behind schedule. For this actual project the SPI reported the project was falling behind schedule. Though SPI and associated chart clearly depicts the variance it does not provide the means for how to address the issue. We have the what (the project is running late), we have the so what (it is costing millions in lost revenue everyday) but what we don't have is the now what (what to do to solve the problem).
Complete the following form to access resource.
"*" indicates required fields