Benefit of Controlling WIP
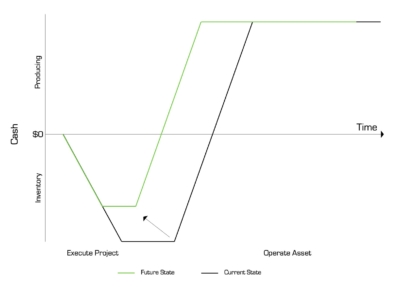


The ability to compress project duration by reducing WIP during the project delivery process enables owners to better control time to market. Owners can select to start the project at the same time and complete it sooner or wait to start the project and complete it at the same time as a non schedule compressed project.
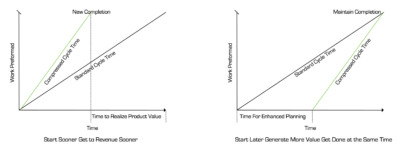
The ability to compress project duration not only optimizes use of cash but also enables control of time to market. Shorter project durations enable investors and / or owners to get to revenue sooner or wait later and see what competitors are doing.
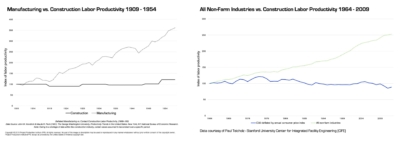
As depicted by these two graphs, the first create by S. George for the Project Production Institute (PPC0 using date from the US Bureau of Economic Research and the other by Paul Tiecholz of the Center for Facility Engineering (CIFE) at Stanford University. Though the charts cannot be connected side by side they depict that the construction industry has shown no improvement in productivity over the past 115 years. Recent analysis by McKinsey indicates productivity in construction has declined since the conclusion of COVID 19.
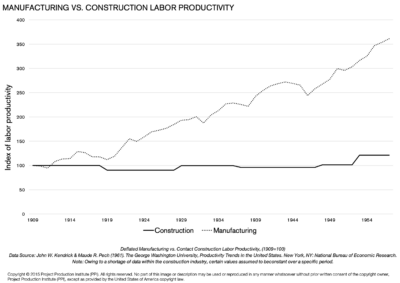
“This differing path results in way more efficiency and productivity, as seen in many of the analyses comparing nonfarm industries to the construction industry. A while back we overlaid two productivity graphs, one from the National Bureau of Economic Research (NBER) and another from Paul Teicholz of Stanford University, on a timeline of innovations in both manufacturing and construction. What we observed was very telling: (1) for the most part, beginning in the early 1900s, the construction industry has shown no material improvement in productivity, and (2) other industries have shown significant gains in productivity. The net impact over the forty-eight-year period shows that manufacturing productivity ended up about 3.6 times higher than construction productivity at the end of the period.”
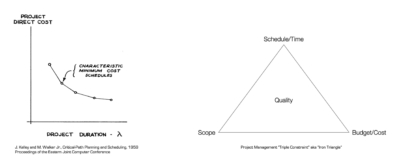
Building upon the time/cost tradeoff proposed by Kelley & Walker1 (see graphic 1), the project management “iron triangle” proposes a rigid relationship between scope, time and cost. Meaning, “you can have two but not all three objectives.” Operations Science proves the time/cost tradeoff and iron triangle to be false enabling significant reductions in cost and time while maintaining or even enhancing scope. Project Production Management (PPM) provides the framework for applying Operations Science and ”breaking” the iron triangle.
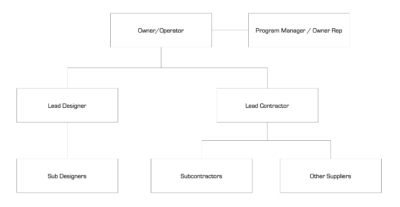
Owners, especially in the building sector organize projects based on having a design team and construction team. The design team is led by an architect in the case of a building project and by and engineering firm if a civil works or industrial project. The construction team is led by a construction management firm or general contractor. Owners may elect to purchase direct from OEM suppliers and may opt to place the construction management firm over all of the service providers. Often times owners will engage a program or project management team to support the administrative aspects of a project.
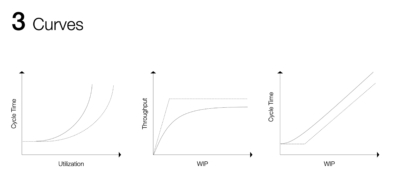
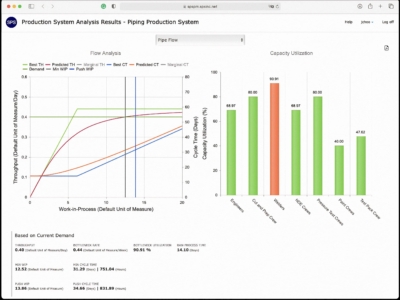
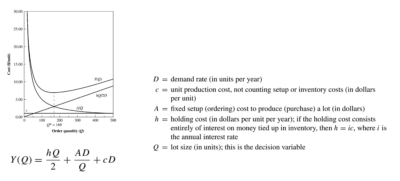
Operations Science mathematical equations depicted in these three curves define the relationships between throughput, cycle time, work-in-process and capacity utilization along with the impact of variability. Understanding these fundamental relationships is critical when designing or optimizing any production system.
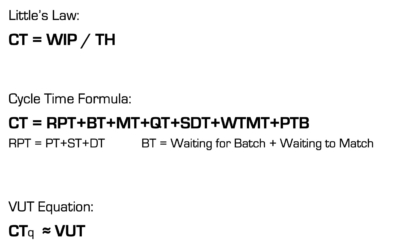
Operations Science is comprised of various mathematical equations that explain and are used to understand and influence production system behavior. These equations include, Little's Law, the Cycle Time Formula and the VUT equation also known as Kingman's formula after John Kingman who published it in 1961.
WIP is the proxy for time and time is money. If WIP is too low cycle time or in this case project duration will increase, if WIP is too high, cycle time or in this case project duration will increase. Therefore, WIP is both a leading indicator and a key mechanism for controlling production system performance / project cost, duration and use of cash.
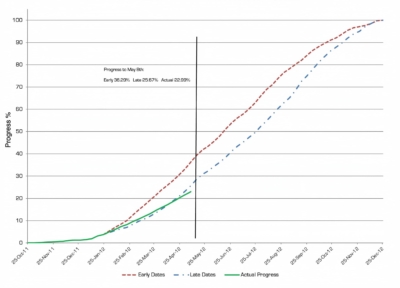
Project controls professionals use the SPI chart to depict whether a project or element of a project is on, ahead or behind schedule. For this actual project the SPI reported the project was falling behind schedule. Though SPI and associated chart clearly depicts the variance it does not provide the means for how to address the issue. We have the what (the project is running late), we have the so what (it is costing millions in lost revenue everyday) but what we don't have is the now what (what to do to solve the problem).

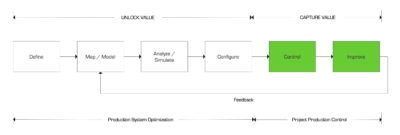
PSO is used to design and understand production system behavior. This is done through modeling an existing or new production system, using analytical modeling and or discrete event simulation (DES) to determine the production system's optimal frontier for use of capacity, amount of WIP, etc. based business and other objectives. Policies derived from the optimization effort are then used to configure the production control system and associated performance metrics.


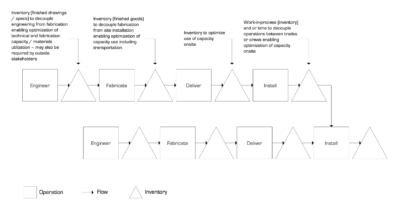
Production systems are mapped using a specific set of symbols. These symbols are 1) drum = stock, 2) rectangle = operation or process center, 3) triangle = queue and 4) line with arrow = flow of items or routing.
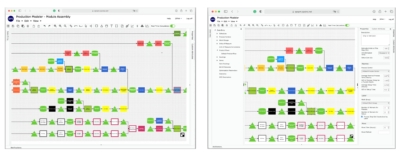
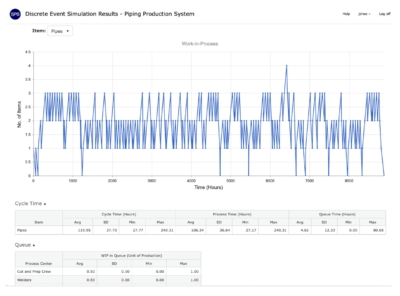
Outputs from SPS|PM Production Modeler.
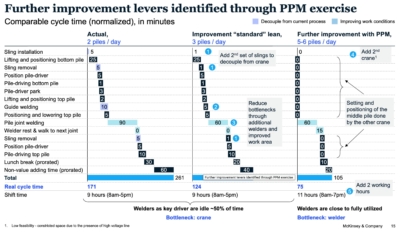
This graphic prepared by McKinsey outlines opportunities for improvement for a road construction project. McKinsey and SPS partnered in a PSO study which was then used as the basis for reducing the project duration.
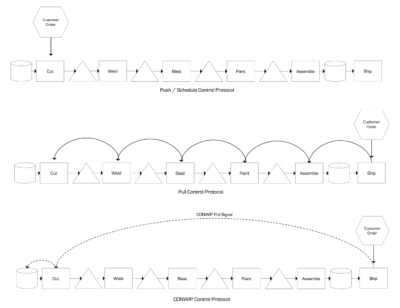
There are three primary protocols for production control. These are 1) Push where work is released into the production system using predetermined objectives i.e. a schedule, 2) pull where work is pulled by the downstream operation / process center from the upstream operation / process center and 3) CONWIP which is same as pull but sends a signal to the beginning of the production system. The objective of the Pull and CONWIP protocols are to control or cap the amount of WIP in the production system.
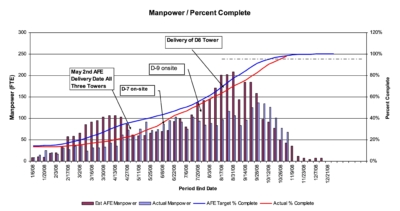
The benefits of implementing Project Production Control can be seen on this chart. After being delayed the project was completed earlier with less labor than planned.
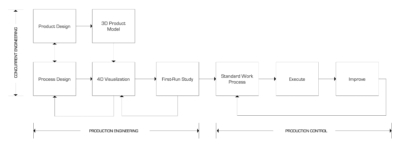
Computer Aided Production Engineering (CAPE) provides the framework for optimizing production processes. It can be used in the context of a PSO effort or a PSO effort can be done during a CAPE initiative. CAPE uses various methods and technologies to improve throughout, reduce cycle time, reduce risk and improve quality.
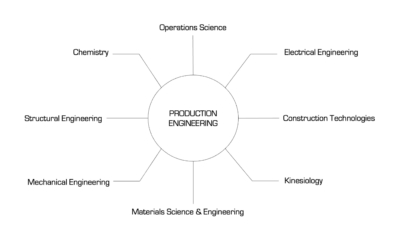
Computer Aided Production Engineering (CAPE) leverages the sciences to optimize production system behavior.
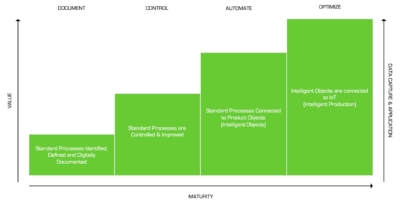
The ability to capture and use data differs amongst various companies. With the advent of AI this data capture must be a high strategic priority. This graphic sets forth maturity for which enterprises capture and use data.
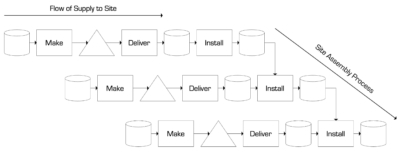
The site construction process flows vertically or diagonally as depicted in a bar chart. Supply flows horizontally into each operation that requires materials.

To reduce the WIP between fabrication and installation a CONWIP control protocol should be used. CONWIP is used to send the demand signal from the site to fab. Fab operates as a slave to site.
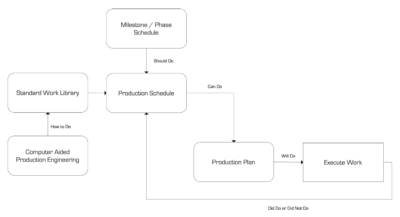
The purpose of Project Production Control (PPC) is to ensure planned work sequence is followed and the efficient use of resources (inventory and capacity contributors – equipment, labor and space).
PPC takes milestones from the master or phase schedule then using CAPE created standard work explodes the milestones into tasks. Production plans are used to commit work and determine if work is complete. The commitment and updating the status of tasks automatically updates the production schedule and if so desired the master / phase schedule.
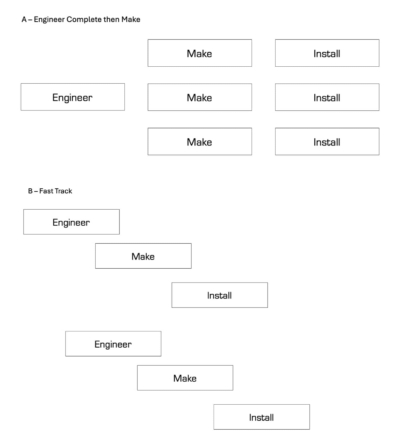
There are several project deliveries strategies being used today. Some focus on process and others on commercial relationships. This includes, design-bid-build, design-build, time & materials or reimbursable, etc. Each strategy has implications for WIP and the associated cost, duration, use of cash and risk.
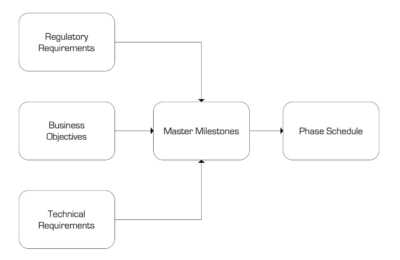
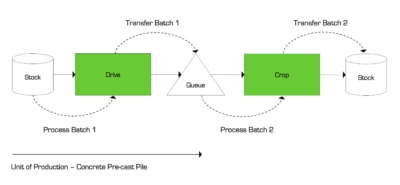
Batches or a quantity of items that are group together either for purpose of processing or transferring can reduce set-up times, maximize use of raw materials and capacity. However if batches are too large they will increase WIP which will increase cycle time resulting in increased cost, duration, use of cash and risk.
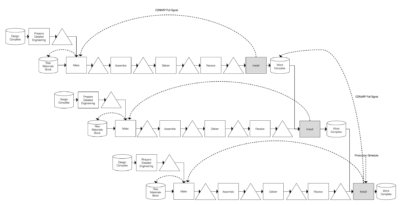
The use of standard work coupled with CONWIP production control protocol provides the most effective means of controlling work from onsite through supply.
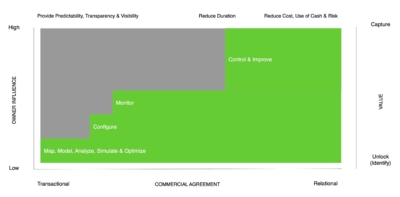
Effective implementation of Project Production Control will always provide high return on value delivered including reduced project duration, cost, use of cash and risk while quality is enhanced. Which parties capture the performance improvement is a function of the commercial agreements that are in place.
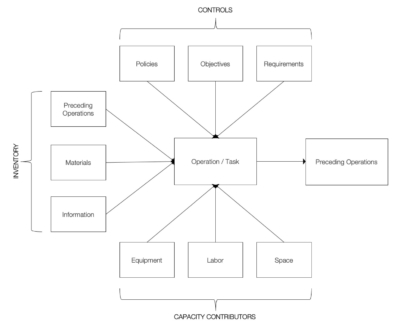
Site supervision must perform a complex planning task where every day they are attempting to match what is available in the way of inventory (predecessor work often by others is complete, materials and relevant information are available while capacity contributors (equipment, labor and space) are also available, to create a viable plan that is in accordance with stated controls. Note equipment can be further classified as small tools, large equipment and shared equipment.
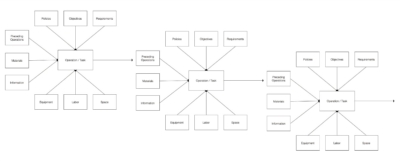
The following graphic expands on the site planning challenge depicting the interrelation of the predecessor work.
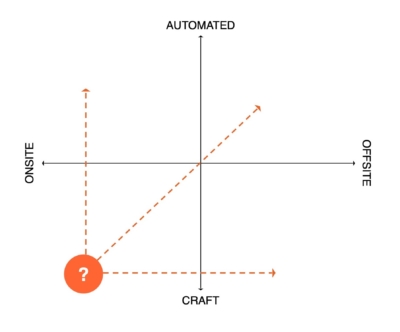
When designing a construction project production system decisions must be made regarding to fabricate and assemble onsite or offsite and whether to use automated or craft based resources.
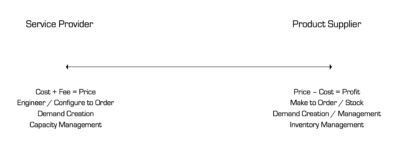
Contractors including design firms, fabricators and construction companies including specialty contractors operate based on a service model. They maintain capacity for hire regardless of the commercial agreement. Product suppliers make goods using standard or configurable products. As contractors endeavor to move from service provider to product supplier it is imperative this is understood.
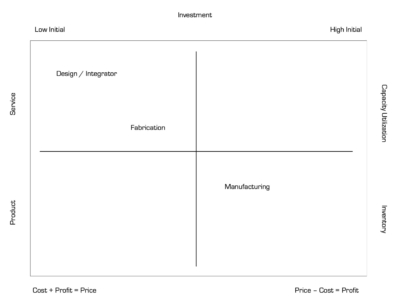
A product supplier operates using a different business model and the need to address different challenges than a service provider.

In reality the majority of non liquid parts that go into a construction project are fabricated (made) offsite. The question is really one of where best to assemble the parts – onsite or offsite.
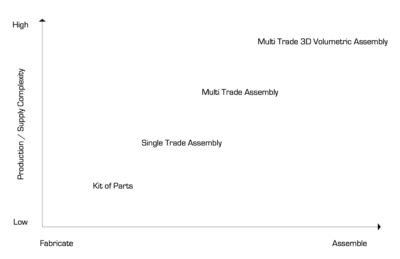
As use of doing work offsite increases various strategies are being pursued from making a kit of parts to the assembly of sub-assemblies using multiple specialties.
The percent complete accounting method ignores the cost of inventory. While the service provider business model is rewarded for unnecessary amounts of inventory during project delivery. This coupled with other factors including EVM rules of credit and the attempt to reduce price / cost results in unnecessary inventory which increases cost, duration, use of cash, risk and while negatively impacting quality.
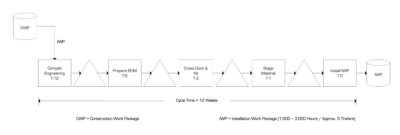
AWP/WFP sets forth a specific timeline and policies that are designed to use an inventory buffer or stock to shield the site from variability such that utilization can be maximized. Though this may work to increase "time on tools" the increase in WIP will reduce throughput and increase cycle time / duration.
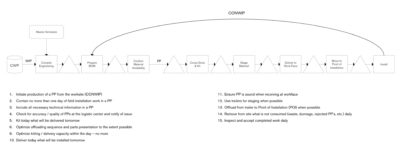
To ensure site and supply are synchronized various policies need to be revised as well as moving from a schedule and prescribed timeline to use of CONWIP.
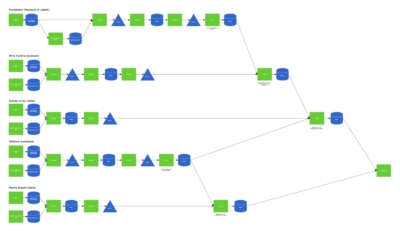
Long lead items create a matching problem between when each item will arrive.
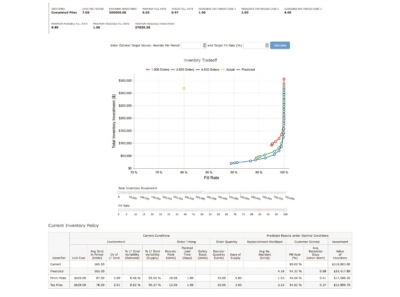
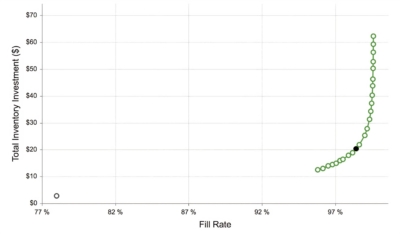
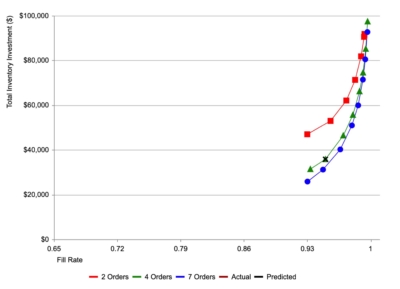
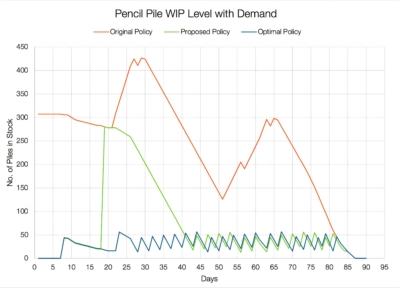
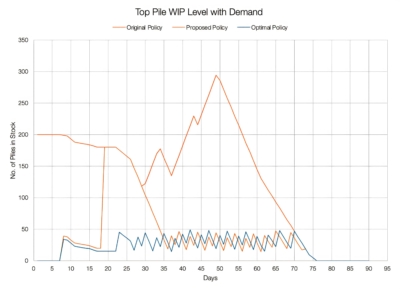
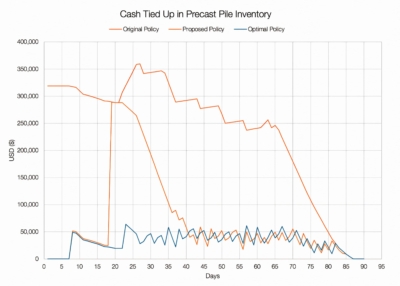
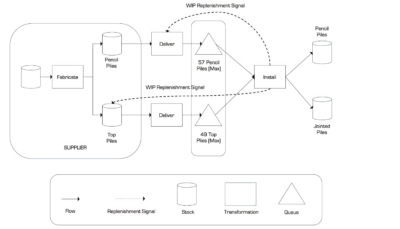
This process flow diagram depicts a production system for making, delivering and installation of two types of piles at a specific project. It includes max inventory policies and use of CONWIP control.
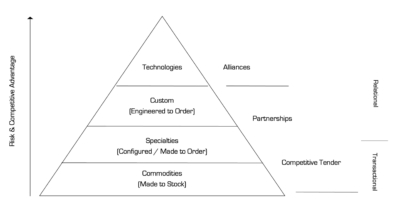
Not all supplies are the same and should not be managed based on being the same. This graphic provides a framework for understanding supplier type and a proposed commercial model from relational to transactional.

Accepted practice based on schedule endeavors to control the actual package flowing through the process of based on current mindset the schedule. A more effective means focuses on control of the production system including use of CONWIP and production based performance indicators (WIP, Capacity Utilization, etc.)
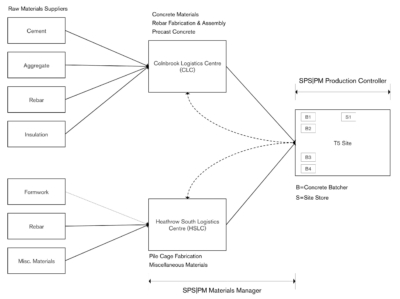
The T5 logistics solution including the use of two consolidation centers and one site store. Inbound materials other than large elements and modules requiring special transport flowed through one of the two logistics centers. Both logistics centers were also used to fabricate and assemble various items including reinforcing steel and precast. The flow of work from detailed engineering through site installation was control using a purpose built software that would later be branded as SPS|Production Manager.

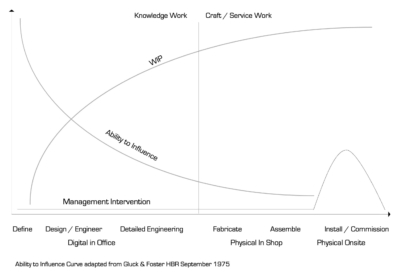
In 1975 Gluck and Foster proposed the ability to influence diminishes over time and that when things go wrong, management attempts to intervene but it is too late. PPI proposes the reason for this is the ongoing increase in WIP – the WIP of decisions along moving from the digital world to the physical world.
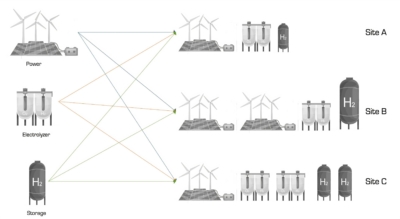
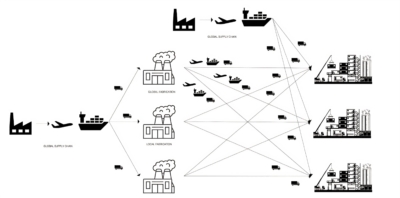
Deployment projects are different from conventional single site projects. Deployments require localization of the design, working with numerous local authorities, a many to many supply challenge and often times ongoing technology refresh or upgrade to mention a few differences.
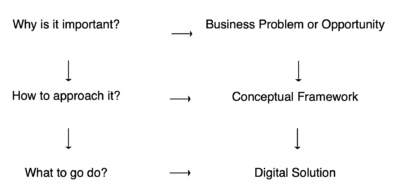
This graphic sets forth a framework for contemplation of why and what should be automated and what conceptual framework should be considered.
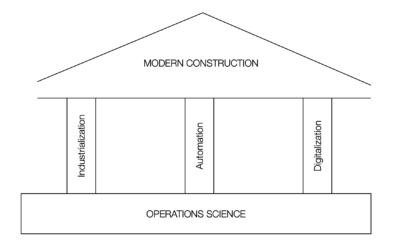
The "house" of modern construction outlines the key elements of modern construction including automation, industrialization and digitalization with the foundation being Operations Science.
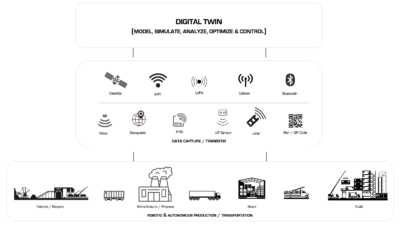
Ever increasing computing power, speed of networks, and ability to store / process mass amounts of data coupled with industry 4.0 (AI, IoT, Autonomous, Robotics, etc.) integrated with Operations Science will set the foundation for Self Forming, Self Optimizing, Self Controlling Production Systems. Schedules as dashboards!
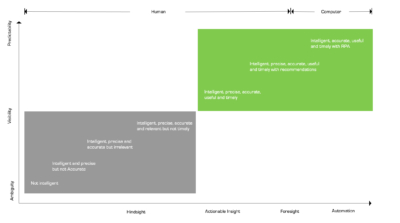
Not all data is the same and useful. It is important to ensure data is relevant, timely and accurate.
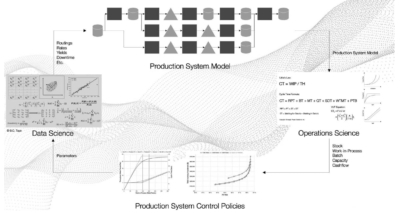
In a recent PPI presentation, Mark Spearman and Phil Kaminsky weighed in on the differences and applications of operations science and data science. They spoke about how both seek to explain how a
complex world works and referenced IBM’s definition of data science: “Data science is a multidisciplinary approach to extracting actionable insights from the large and ever-increasing volumes of data collected and created by today’s organizations.” They also explained operations science is the science that describes the behavior of operations. They then proposed that operations science be used to model, analyze, optimize, and better understand the production system, while data science should be used to analyze complex data, in real time, to gain insight into the production system’s behavior.
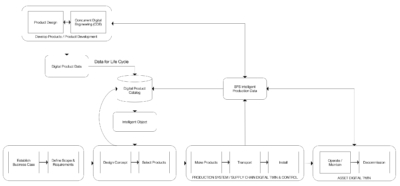
Production based feedback and feedforward will create an entire new way to design and make.
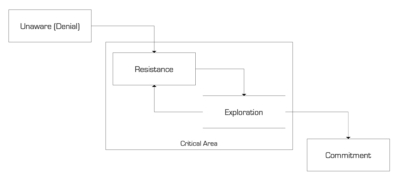
If there will be any change humans must progress through a four phase process consisting of 1) unaware, 2) resistance, 3) exploration and 4) commitment. For each phase there are recommended actions.
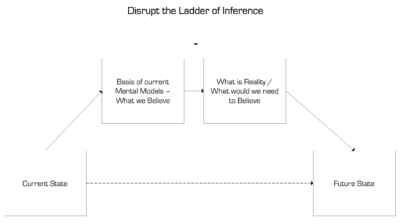
Our thoughts are based on our beliefs and our beliefs are based on our thoughts. It is not I will believe when I see it but rather I will see it when I believe. Therefore, disrupting the ladder of inference is critical.