ABSTRACT
Value Stream Mapping (VSM) is a term that describes a family of popular techniques used to analyze production systems. Popularized in the 1980s by Womack and Jones [1] and the Lean movement, VSM is a staple tool associated with lean practitioners. Modern day practice of VSM, heavily influenced by the book by Rother and Shook [2], is to map a current and future state of the flow of production, and to identify ways to eliminate waste or non-value adding activities, leaving only value-adding activities.
Following earlier critiques of VSM, we make the argument that its evolution and current use misses the original intent to understand materials and information flows in a production system. We review the history and original purpose, showing that as it has evolved, the definition and application of Value Stream Maps have become less clear. The historical review allows us to put the Value Stream Map in a more precise and useful setting, reverting to its original historical intent. The critical point is to understand the sequence of transformations of raw materials and information that take place in producing any type of product or delivering a service. With this clarification and corresponding modifications to the technique, the Value Stream Map becomes a valuable tool [2] in the application of Project Production Management to optimize production system behavior.
Keywords: Value Stream; Demand; Flow; Transformation; Stock; Production
Introduction
The Value Stream Map is a popular tool used to map and analyze the operations in a production system. As briefly reviewed in [3], the Value Stream Map is a variant of process flow mapping, providing a visual representation of the sequence of operations that take place in a production system. The book by Rather and Shook [2] has been influential within the Lean community of practitioners in spreading the application of VSM. Common practice as defined in [2] is to develop a “current state” map describing the current sequence of operations and activities in a production system, focusing in particular on capturing the cycle times of each operation in the system. The individual operations are assessed to understand how much of the cycle time is “value-adding” and how much is “non-value added” or “waste.” Looking for opportunities to identify and eliminate the different types of waste [1], a future state VSM is developed to describe how the production system will look, once improvements are implemented.
In this article, we first conduct a brief review of the origins of Value Stream Maps, and indeed, how they came to be called “Value Stream Maps”. In reviewing the history, we explain the earlier intent and application as practiced, for instance, by Toyota Motor Corporation. Our historical review concludes with the works of Womack and Jones [1] and subsequently Rother and Shook [2] who popularized the concept in the West, but in so doing, also evolved the purpose and application.
We next enumerate past critiques of Value Stream Maps as described in [2]. There are several critiques of VSM, including [3] [4] [5]. All of them can be paraphrased as “VSM, as practiced in the West, expands upon the original intent and purpose in a way which makes it more qualitative than necessary. More importantly, it minimizes the critical point that everything starts with base materials, whether by extraction or recycling, and goes through a series of transformations to become the final product.” A more detailed examination of these critiques provides the basis of the argument made here for the most fruitful perspective to view Value Stream Maps and how to effectively use them as a tool to apply Project Production Management.
Value Stream Map - Historical Review
As mentioned earlier by [3], the notion of a Value Stream Map is not a particularly recent concept, nor were value stream maps the very first embodiment [6] of mapping processes. “Where do Value Stream Maps Come From?” is indeed the title of an informative article by Michel Baudin [7]. We are indebted to that article as a source for confirming some of historical events, and for some of historical references cited herein.
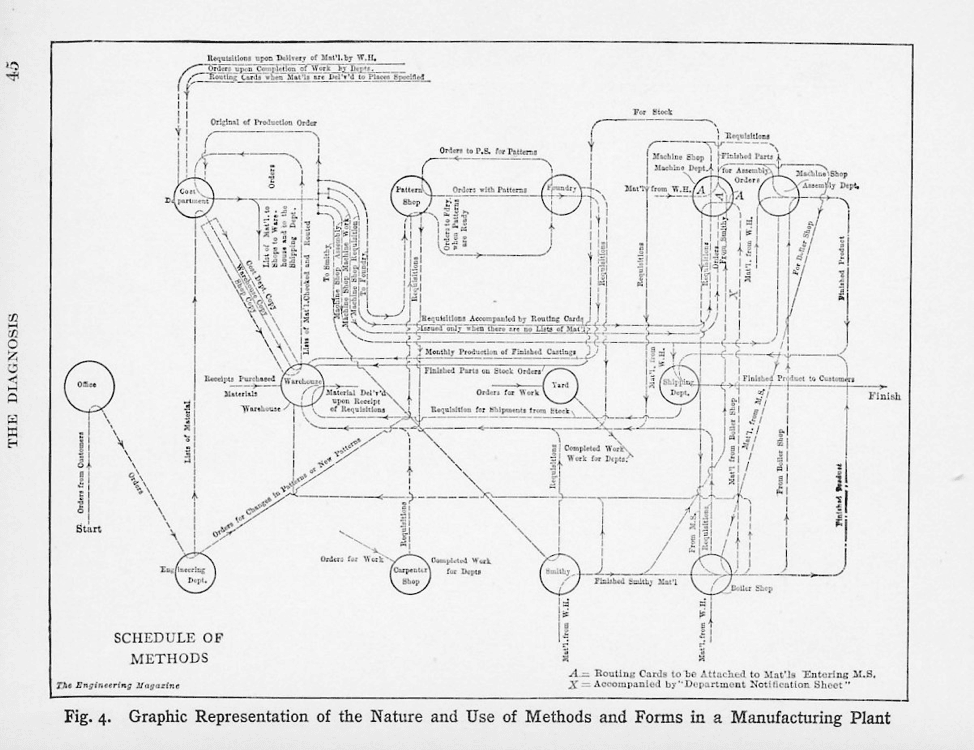
The notion of mapping the sequence of operations and flow of materials and information in a production system dates back to at least Ford’s mass production and earlier [8] [9]. Practitioners and researchers at the time were concerned with thoroughly understanding the flow of materials and information to transform materials from mine to delivery to customer. Indeed, Figure 1 is taken from an early book by Knoeppel [6], cited in [7], as supporting evidence that such mappings of operations were understood and used in designing and analyzing production systems.
Now, Ford being a single product company (you can have any color as long as it’s black), did not have a tremendous focus on Work-In-Process and its effect on production and throughput. However, later manufacturers, most notably Toyota and other manufacturers in Asia, recognized the value of the concept and extended it across all their suppliers in order to have a better understanding of WIP and its impact on production. Baudin [7] cites conversations with several Toyota alumni who explained that the concept was called Materials and Information Flow Diagram. Toyota’s Operations and Management Consulting Division developed the tool and used it selectively with suppliers, that is wherever the main issue with flows was with materials and information related to these flows.
What is notable is that none of these practitioners used the label “value stream” to describe the concept, but instead the more accurate “materials and information flow diagram.” It is also clear that as used, it was never a universal tool for identifying waste removal and improvement opportunities. In fact, Baudin [7] cites a Stanford Business School case on Johnson Controls and a 2002 presentation [10] by Hajime Ohba, leader of Toyota Supplier Support Center, which explicitly argue against using such diagrams as a universal tool.
So how did “Materials and Information Flow Diagrams” become “Value Stream Maps”? The technique was brought to the US by the Toyota Supplier Support Center but was never called Value Stream Mapping (or we could say, “never mentioned the term ‘Value Stream.’”)
The term ‘Value Stream’ was first introduced by Womack and Jones in [1]. Womack, an MIT professor, led a number of important comparative studies on worldwide production in the 1980s, the most significant being a study of the automotive industry – the International Motor Vehicle Program. Womack left MIT shortly after the publication of his book [1], co-authored with Jones, to found the Lean Enterprise Institute (LEI). Baudin [7] quotes Chet Marchwinski of LEI for additional clarification of the introduction of the term “Value Stream,” re-quoted below:
“According to John Shook, Materials and Information flow diagrams were created by Toyota’s OMCD group. They were introduced to the U.S. by TSSC, not Shingijutsu, and ultimately made their way to the Lean Enterprise Institute. Here’s how.
Jim Womack and Dan Jones introduced the concept of “value stream” and in Lean Thinking [1] told readers to map them. While the book had an example and descriptions, the process wasn’t laid out. At that time, Mike Rother had just become very interested in Toyota’s M&I flow mapping so John introduced him to Jim and Dan. He said Dan was especially interested in M&I mapping too.
Mike was the lead author (John is co-author) of the workbook “Learning to See” [2] and developed the mapping workshop. Dan came up with the title “Learning to See”. Jim and Dan coined the term “value stream” and “value-stream mapping.” More importantly perhaps, the reason why there are little or no references to the tool in Toyota materials is that Toyota never taught it widely.
John said it was and still is used by the select group of TPS experts, mostly in the OMCD organization. (I think it is now Operations Management and Development Division.) So, the tool came to LEI in a roundabout way from TSSC, according to John.”
In summary, “Materials and Information Diagram” accurately describes the original intent. The term “Value Stream Map” was never used by the early practitioners. The term “value stream” may be less descriptive but conveys the intent of Womack, Jones, Rother and Shook to use the tool for opportunities to identify and reduce waste – and it certainly has more appeal than calling it a “waste stream map.” We close this section with quoting a commentary by Art Smalley of the Lean Enterprise Institute [11], which clearly articulates the limits of the tool and the unintended consequences of calling it a Value Stream Map:
“The reason there are no value stream maps in most Toyota plants is very simple in hindsight. It was a tool developed primarily as an analytical aid to look at material and information flow problems in certain processes. In fact, the actual name of the tool at Toyota is “material and information flow analysis” – not value stream mapping.
….
The key point is that the tool was created to analyze and solve a specific category of problems Toyota faced in new production lines and in helping suppliers implement lean. From this fairly specific local origin in Toyota, the tool was slightly modified (the human motion emphasis was reduced) and popularized in the U.S. by my good friend and former Toyota colleague John Shook, and his co-author Mike Rother, in their insightful, best selling workbook “Learning to See”.
The title of the work I think is important. Originally the authors had considered titling the workbook Material and Information Flow Analysis for Lead Time Improvement and Work Place Kaizen. This name, which would have been truer to the original intent of the material, was changed for marketing reasons to “Learning To See”. The workbook went on to sell over 125,000 copies, and has affected the direction of lean efforts in the U.S. more than any single publication.
Unfortunately the object of what the workbook urges the reader to see is not as clearly communicated in the catchier title – and here is where the law of unintended consequences kicks in. The book is about learning to see what is primarily a material and information flow problem, or essentially elements of the JIT pillar of Toyota’s production system (flow, takt time, level, and pull production).
… The technique used in the workbook simply measures the overall manufacturing lead-time versus production value add time. Everything non-value adding (i.e. the waste) is to be eliminated and answering seven specific questions outlined in the workbook will help you accomplish some of this goal.
…
This is fine for Toyota. Internally they well know the limits of the tool and understood that the it was never intended as the best way to see and analyze every waste or every problem related to quality, downtime, personnel development, cross training related issues, capacity bottlenecks, or anything to do with profits, safety, metrics or morale, etc.
No one tool can do all of that. For surfacing these issues other tools are much more widely and effectively used. Unfortunately, the average user of the workbook tends to copy the pattern expressed in value stream mapping regardless of the nature of their manufacturing problems.
The unintended consequence of the success of the method has been to convince many people that it is a universal tool for identifying all problems in manufacturing operations. Marketing hype helps reinforce this notion. “Just draw a value stream map and it will show you all your problems to work on” is a popular refrain that I hear quoted in companies attempting lean.
This guidance however biases companies with major quality, downtime, or factor productivity problems to deemphasize them since those items are not surfaced well using the method and questions outlined in value stream mapping. The tool just does not frame these problems well
by design.”
Value Stream Analysis For Project Production Management
The historical view highlights a number of important points. First, Value Stream analysis is not a silver bullet to diagnose all opportunities to optimize production system performance. As Smalley [11] and others note [4], is largely qualitative because it does not completely capture all input and output parameters of a production system.
While it can be used for some quantitative calculations, such as in [4, pp. 307-310] which illustrates the use of Little’s Law to calculate cycle times, Hopp and Spearman [3, pp. 188-189], systematically enumerate some of the limitations. The term “value-added” is not precise, as the historical commentary has already revealed. The focus on “value-added” time (primarily on process time), frequently does not adequately capture the physics of the operation and does not represent a reasonable target for overall cycle time. Value stream analysis does not provide a means for diagnosing the causes of long cycle times. While capacity and demand data are recorded in a value stream map, current practice frequently does not compute utilization and thus misses situations where a production system is facing demand in excess of capacity. And while there is a design step in Value Stream Mapping to depict a “future state,” there aren’t any means to confirm whether the future state is actually achievable.
Finally, Value Stream Mapping is often promoted as an exercise where all that is needed is a big wall and lots of sticky notes to map and understand a process. This leads to inevitable frustration. Once the high-level Value Stream Map is completed, the real challenge appears: how to capture the complexity and detail of a process or project that may have thousands of parts and operations. That cannot be accomplished with Value Stream Mapping. The approach works well enough for high volume, repeatable products and tasks but is completely inadequate to understand the complexities and task interactions in real world projects and their associated processes. The common failure to account for these complexities in an Operations Science framework has often led to the sequence as described by an industry manager, “most Lean efforts are 5S, Value Stream Mapping and then done.”
The scope of what a Value Stream Map covers has also become less clear over time, with some confusing the term “Value Chain” with “Value Stream.” Looking through the use of the term “Value Chain Analysis,” as defined by Porter [12] generally covers not only the production system, but the activities covering consumption and the fulfillment of customer demand. Value Stream Analysis generally covers just the production system. So, consider an example – all the activities contributing to the production of a pump would be covered in a Value Stream. The Value Chain would include not only the production of the pump, but would also cover activities over the total lifecycle of the pump – the servicing of the pump and the customer’s use of the pump, and other stakeholders who participate.
Perhaps the most important critique of Lean practitioners’ use of Value Streams is termed “the value-added fantasy” in [4, p. 173], who describe it as “the perception that concentrating on value-added activities and eliminating non-value added activities for a production system will provide the most profitable performance for a production system.” It is based on a mistaken perception that:
Cycle time == value-added time + non-value-added time
Decreased non-value-added time results in increased efficiency and decreased cost.
This is overly simplistic. It overlooks the fundamental Operations Science relationships of the VUT equation and Little’s Law. For instance, using a capacity buffer to achieve low cycle times would certainly be interpreted as introducing inefficiency into a system. Most Lean practitioners would consider a capacity buffer as non-value adding activity, reducing the efficiency or productivity of a resource, and try to eliminate it with the mistaken perception that it would reduce cycle time and increase efficiency. Another way of looking at it is that focusing only on waste (muda) ignores variability (muri), and the fact that variability has to be buffered regardless whether by capacity, inventory or time.
How can the above critiques be addressed? The original intent of Value Stream Maps, stretching back to the 1900s – to map materials and information flows – is intrinsically valuable for describing and analyzing production systems. As described in [4, p. 46], Value Streams should focus on mapping demand for, and transformation of, materials and information. The purpose of any production system is to transform material or other resources into goods and services to meet demand. Production represents materials, resources or information moving through connected sequences of operations performed by different types of resources – machines, people, natural processes – or some combination thereof. Following [4], both production and demand are characterized by a rate – a rate at which production occurs, or a rate at which demand has to be met. A flow is represented by collections of production routings or demand streams. Inventory, Work-in-Process (WIP) or stocks represent materials, resources or information waiting for a production or demand process. Value Streams map production and demand streams with particular attention to the inventories or WIP that separate demand or production streams, representing the mismatches between demand and production.
Why are we being so particular about the precision of the definition for Value Streams? We want this paper to help the reader understand the perspective of transforming base/recycled materials to the end product, and in particular the cost and time of the transformation and its impact on the final product. As noted in an accompanying article in this Journal, Work-In-Process (WIP) is an important parameter in a production system with excess levels of WIP, or WIP in the wrong places having very bad consequences for production system performances. A well-executed Value Stream makes apparent where the WIP is, and helps calculate the total WIP in the end-to-end process. It is important to note that it is impossible to eliminate WIP – production systems need WIP to produce throughput. Efforts to push WIP to one place or another in a system or simply eliminate it will almost certainly result in WIP appearing elsewhere in the system, generally with undesirable consequences on time and cost. We view the Value Stream as an operations analog to Activity Based Costing (ABC) [13] [14] , which attempts to more closely match costs with resources consumed in an activity or an operation, aiming for a better match of so-called indirect costs to the activities or operations that incur those costs.
With this level of definition, we arrive at the process mapping conventions that have been used in several articles in this Journal and in [3] [4]. A tutorial article on the practice and application of Operations Science principles to complete a Value Stream Analysis will follow in a future Journal edition.
Conclusion
We have traced the historical evolution of Value Stream maps starting with their origins as a tool for mapping materials and information flows in industrial plants. We have reviewed several historical critiques of their use and application. Finally, we have proposed a return to the original purpose as one tool in the Operations Science arsenal for Project Production Management. In a future article, we will provide a tutorial to illustrate the efficacy and power of our proposed approach for Value Stream Analysis.
References
J. P. Womack, D. T. Jones and D. Roos, The Machine That Changed The World: The Story Of Lean Production – Toyota’s Secret Weapon In The Global Car Wars That Is Now Revolutionizing The World, Free Press (Reprint Edition), 2007.
M. Rother and J. Shook, Learning To See, Brookline MA: Lean Enterprise Institute Inc., 2009.
W. J. Hopp and M. L. Spearman, Factory Physics (Third Edition), Waveland Printing Pr., 2011.
E. S. Pound, J. H. Bell and M. L. Spearman, Factory Physics For Managers: How Leaders Improve Performance In A Post-Lean Six Sigma World, McGraw-Hill, 2014.
C. Hohmann, “VSM Pitfall: Unnecessary Process,” 15 August 2014. [Online]. Available: https://hohmannchris.wordpress.com/2014/08/15/vsm-pitfall-unnecessary-process/. [Accessed 9 11 2018].
C. E. Knoeppel, Installing Efficiency Methods, New York: Engineering Magazine, 1915.
M. Baudin, “Where do Value Stream Maps Come From?,” 25 October 2013. [Online]. Available: https://michelbaudin.com/2013/10/25/where-do-value-stream-maps-come-from/.
F. G. Woolard, Principles of Mass and Flow Production, The CLBM LLC, Aniv Spec R Edition, 2009.
G. Silbertson and A. Maxcy, The Motor Industry (1st Edition), George Allen & Unwin , 1959.
H. Ohba and C. Kuhlman-Voss, “Leadership and the Toyota Production System, Presentation at AME 2002 Conference,” 2002. [Online]. Available: http://bm.nsysu.edu.tw/tutorial/kuo/rm/Ohba.pdf. [Accessed 6 November 2018].
A. Smalley, “Art Smalley’s Perspective on VSM,” 2005. [Online]. Available: https://michelbaudin.com/2013/10/25/where-do-value-stream-maps-come-from/. [Accessed 6 November 2018].
M. E. Porter, Competitive Advantage: Creating And Sustaining Performance, New York: Free Press, 1998.
S. Shingo and A. Dillon, A Study Of The Toyota Production System: From An Industrial Engineering Viewpoint, Productivity Press, 1989.
Y. Monden, Toyota Production System: An Integrated Approach to Just-In-Time (4th Edition), Productivity Press, 2011.
D. Hounshell, From The American System To Mass Production, 1800-1932: The Development of Manufacturing Technology In The United States (Studies In Industry And Society), Baltimore MD: Johns Hopkins University Press, 1985.
N. M. Company, Nissan Production Way (Jissen Nissan seisan hoshiki), Tokyo: Nikkan Kogyo Shimbunsha, 2005.
M. Aoki, All About Car Plants: Engine Manufacture, Coating, Assembly and the Keys to Production (in Japanese), [Web.] Retrieved from the Library of Congress, https://lccn.loc.gov/2013470908., 2013.
T. M. Corporation, “Illustration of the Toyota Production System,” [Online]. Available: https://www.toyota-global.com/company/vision_philosophy/toyota_production_system/illustration_of_the_toyota_production_system.html#!. [Accessed 6 November 2018].